The Closed-Lost Test: How to Know Your ICP Is Decorative
Most ICP documents are written once, admired in a kickoff deck, and never falsified. That last word matters. A profile that can’t fail a test isn’t a targeting tool; it’s a mission statement.
The falsification test is simple, and Landbase’s 2026 ICP framework puts it plainly: if your closed-lost deals share the same firmographic profile as your closed-won deals, your ICP is missing a layer.
“Mid-market SaaS, 100 to 500 employees, North America, $20M to $100M revenue” will match your best customer and your most expensive dead opportunity with equal confidence, because both companies genuinely are those things.
The scale of the problem is bigger than most teams admit. Some 68 percent of B2B companies have not clearly defined their ICP at all, per Landbase’s 2026 research, and among those that have, the most common failure mode is a definition built entirely on firmographic attributes because that’s the data that was easiest to pull.
The prize for getting it right is real: teams with a documented, scored ICP report 20 to 40 percent higher win rates and 15 to 30 percent shorter sales cycles than teams without one, per Factors.ai’s 2026 ICP marketing guide.
Explore Our Verified Data
But scoring a bad profile just automates bad targeting. The question isn’t whether you have an ICP. It’s whether your ICP contains any information that separates buyers from lookalikes. Firmographics, by themselves, almost never do.
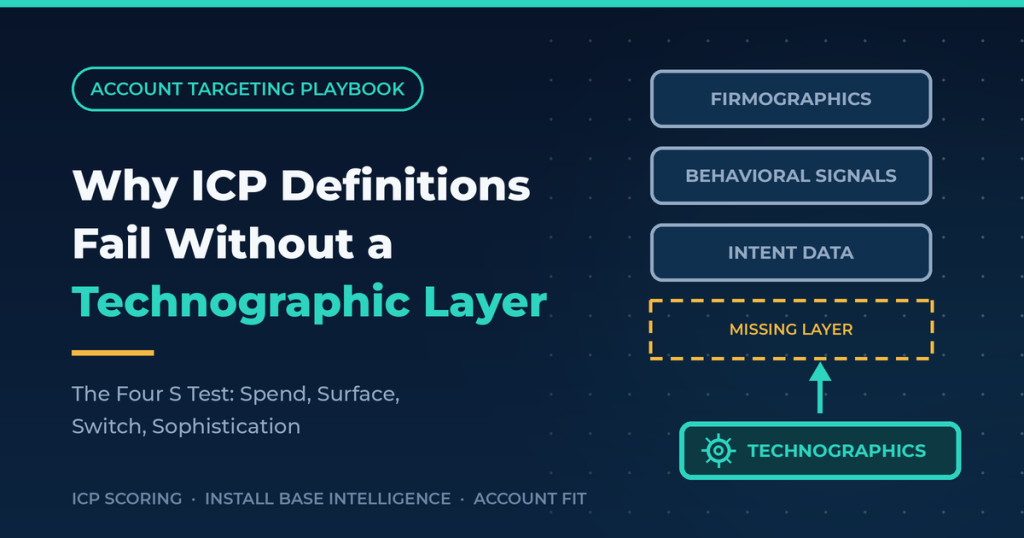
Firmographics Describe a Market. Technographics Describe a Decision.
Think about what each data type actually is.
Firmographics are demographics for companies: size, industry, revenue, and geography. They’re facts about identity, and identity is nearly useless for predicting behavior.
Two 300-person logistics companies in Texas can look identical across every firmographic field, while one runs a modern cloud stack with an allocated software budget, and the other still reconciles operations in spreadsheets and hasn’t bought a new tool since 2019.
Your ICP says they’re the same account. Your pipeline knows they aren’t.
Technographics are something categorically different. A tech stack isn’t a description of what a company is. It’s a record of decisions the company has already made: what it pays for, what it has integrated, what it replaced, and what it tolerates.
Those are receipts, not attributes. When you know an account runs a paid marketing automation platform, a CRM, and a data warehouse, you know things no firmographic field can tell you: that budget exists for this category, that someone inside owns these decisions, that there’s infrastructure your product can attach to, and roughly how sophisticated the team operating it is.
This is why integration fits routinely behave as hard gates rather than nice-to-haves. A product that integrates only with HubSpot won’t land at Salesforce shops, no matter how perfect the firmographic match looks, as CUFinder’s 2026 ICP guide notes, which is why SaaS teams increasingly list two or three required technologies as gate criteria in the profile itself.
The firmographic layer got the account into your addressable market. The technographic layer decides whether a deal is even physically possible.
So the fix isn’t to bolt “tech stack” onto your ICP as bullet number five and move on, which is what most templates do. The fix is to interrogate the stack for the specific signals that predict a deal. There are four.
The Four S Test
Run every account, and your ICP definition itself, through four questions. Together, they turn stack data into a fit prediction.
1. Spend: Does the stack prove the budget exists?
The presence of paid tools in your category, or adjacent to it, is the closest thing B2B has to a public financial disclosure. An account paying for three tools in your ecosystem has an allocated budget line, an owner, and a procurement path that has already approved software like yours.
An account with nothing in the category will require you to create the budget, the urgency, and the buying process from scratch. Both accounts can close. They are not the same deal, and your ICP should not score them the same.
2. Surface: Does your product have somewhere to land?
List the technologies your product integrates with, depends on, or displaces, then make the critical ones gate criteria. This is the layer that turns “good fit on paper” into “deployable in reality.” It also sharpens messaging more than any persona document ever will: an opener built on a verified stack observation reads like research, while an opener built on firmographics reads like a mail merge.
3. Switch: What changed recently?
Stack changes are timing signals hiding in plain sight. A new tool added in an adjacent category signals active investment and an open wallet. A competitor’s product that was recently removed is a displacement window. A migration in progress means integration decisions are being made right now, with or without you.
Tomba’s 2026 technographic guide frames the same signals in reverse for retention: an existing customer quietly adding a competitor’s tag is a churn warning your CSM should see before renewal season. Static stack data tells you about fit.
Stack deltas tell you about timing, and timing is what most “perfect fit” accounts are missing.
4. Sophistication: Can they actually adopt you?
The overall maturity of a stack predicts implementation success, which predicts retention, which is the part of the ICP everyone forgets they’re defining. If your product assumes a data warehouse, an ops team, and API fluency, an account with none of those isn’t a hard-won opportunity.
It’s a churn event with a twelve-month delay. Sophistication signals belong in your negative criteria as much as your positive ones.
An account that passes all four is not just in your market. It has budget evidence, a technical landing surface, a timing signal, and the maturity to succeed post-sale. That’s what an ideal customer actually looks like, and no firmographic filter can find it.
Adding the Layer Without Boiling the Ocean
You don’t need to enrich your entire addressable market on day one. Work backward from evidence.
Start by enriching only your closed-won accounts from the last 4 quarters with technographic data, then do the same for closed-lost accounts. You’re hunting for the technologies that appear disproportionately on one side.
In my experience, this exercise almost always surprises the room: the stack patterns that predict wins are rarely the ones the sales team would have guessed, and a technology nobody was tracking often turns out to be the strongest single disqualifier.
Then codify it small. Pick two or three gate technologies and two or three positive-weight signals, wire them into your account scoring, and leave the other thirty attributes alone.
Growleads’ 2026 scoring research makes the same point from a thousand campaign post-mortems: teams that score on a dozen weighted criteria outperform teams drowning in thirty, and tech stack match deserves roughly the same weight as company size.
The payoff for doing this properly is documented: companies using enriched data for lead scoring see around a 25 percent lift in conversions, per MarketsandMarkets figures cited in Apollo’s 2026 analysis.
Finally, put a refresh cadence in writing, and make it faster than the rest of your ICP. Firmographics can survive an annual review. Technographics can’t, because stacks change constantly through renewals, consolidations, and migrations.
Quarterly re-enrichment is the floor for the technologies you gate on. The general decay math is unforgiving: B2B records go stale at roughly 2.1 percent per month, per Prospeo’s 2026 enrichment benchmarks, and stack data moves faster than contact data.
Where Technographics Will Mislead You
Now, the honest part: this layer has sharp edges, and most vendor content pretends it doesn’t.
Detection accuracy is highly uneven across categories. Front-end, customer-facing tools like analytics, chat, and e-commerce platforms leave fingerprints on the public website and get detected at 85 to 95 percent accuracy, per Tomba’s 2026 guide.
Back-office systems, the CRMs and ERPs, and data warehouses that many products actually care about are far harder to detect from crawls and lean on job postings and surveys that lag reality by weeks or months. If your gate technology lives in the back office, treat the data as a probability, not a fact, and verify on the first call.
Coverage gaps create a subtler trap: a provider that doesn’t track a technology returns silence, and silence looks exactly like absence. You’ll disqualify accounts for “not having” a tool that the data source simply couldn’t see. Ask any provider which categories they cover and how each is detected before you jump on anything.
Staleness produces the most embarrassing failure of all: pitching a Salesforce integration to a company that migrated to HubSpot two quarters ago, off a tag that never got re-crawled. Check the last-detected date if your source exposes one.
And keep the layer in its lane. Technographics predict fit and surface timing hints. They don’t measure active buying intent, and a perfect Four S account can still be six months from caring. The stack tells you who is worth your attention. It doesn’t tell you they’re ready for it this week.