SAP Applications Users List
Total Records Available : - 373,231 Executives
Updated on : May 2017
List Type : Email Marketing, Tele Marketing, Direct Mail
Delivery Format : XLS/TEXT
Deliverability Guarantee : 90%+ for Direct mails, 85%+ for Tele-contacts and 65% to 75% + for emails.
Delivery : Immediate (Within 5 business days upon receipt of payment)
Data Source :
Our 8 million technology intelligence database provides comprehensive information about the technology used in the company. It allows the marketers to reach technology end users / buyers easily. Our technology intelligence team is expertised in identifying the technology end user / buyers and creating their profile.
Description about the List:
SAP applications provide capability to manage financial, asset, and cost accounting, production operations and materials, personnel, plants, and archived documents. This list includes 65,131 Executives from 2,662 companies who is using SAP applications.
Industry Scope :
Reach SAP Applications users within industries such as
- IT Consulting/Services
- Manufacturing
- Finance/Banking/Accounting
- Technology
- And More!
Information Available :
First Name, Last Name, Title, Email Address, Company, Address, City, State/Province, ZIP/Postal Code, ZIP4, Country, Phone, Fax, Employees, Sales, SIC Code, Primary Industry, NAICS and Web Address.
Industry Based Counts :
| SIC | Industry | Records | SIC | Industry | Records |
| 01 - 09 | Agriculture, Forestry, Fishing | 1,010 | 50 - 51 | Wholesale Trade | 12,831 |
| 10 - 14 | Mining | 4,224 | 52 - 59 | Retail Trade | 24,824 |
| 15 - 17 | Construction | 2,381 | 60 - 67 | Finance, Insurance, Real Estate | 39,184 |
| 20 - 39 | Manufacturing | 110,724 | 70 - 89 | Services | 112,600 |
| 40 - 49 | Transportation & Public Utilities | 20,790 | 91 - 99 | Public Administration | 7,049 |
| Null | 37,614 |
| Employee Volume | Sales Volume | ||
| Number of employees | Records | Sales | Records |
| 1 - 4 | 8,901 | Null Sales | 154,319 |
| 5 - 9 | 8,177 | $1 M to 2 M | 15,760 |
| 10 - 19 | 10,519 | $2 M to 5 M | 7,758 |
| 20 - 49 | 20,865 | $5 M to 10 M | 9,087 |
| 50 - 99 | 13,355 | $10 M to 20 M | 10,166 |
| 100 - 249 | 19,588 | $20 M to 50 M | 9,751 |
| 250 - 499 | 13,113 | $50 M to 100 M | 9,756 |
| 500 - 999 | 16,817 | $100 M to 500 M | 22,502 |
| 1000 - 4999 | 48,529 | $500 M to $1 B | 9,615 |
| 5000 - 9999 | 27,431 | Over $1 Billion | 124,517 |
| 10000 + | 110,377 | ||
| Null | 75,559 | ||
Breakdown By State :
| State | Records | State | Records | State | Records | State | Records | State | Records |
| AK | 250 | HI | 363 | MI | 13,003 | NV | 2,215 | TX | 25,093 |
| AL | 2,344 | IA | 1,955 | MN | 11,126 | NY | 34,824 | UT | 1,728 |
| AR | 2,593 | ID | 530 | MO | 5,001 | OH | 13,052 | VA | 11,703 |
| AZ | 6,959 | IL | 23,343 | MS | 1,070 | OK | 1,416 | VI | 10 |
| CA | 73,771 | IN | 10,019 | MT | 268 | OR | 3,814 | VT | 309 |
| CO | 5,563 | KS | 1,741 | NC | 11,636 | PA | 15,334 | WA | 6,940 |
| CT | 11,535 | KY | 2,868 | ND | 473 | PR | 61 | WI | 5,597 |
| DC | 3,961 | LA | 2,134 | NE | 2,275 | RI | 745 | WV | 442 |
| DE | 844 | MA | 13,752 | NH | 773 | SC | 2,071 | WY | 229 |
| FL | 12,768 | MD | 5,411 | NJ | 16,154 | SD | 259 | ||
| GA | 10,705 | ME | 665 | NM | 850 | TN | 6,686 |
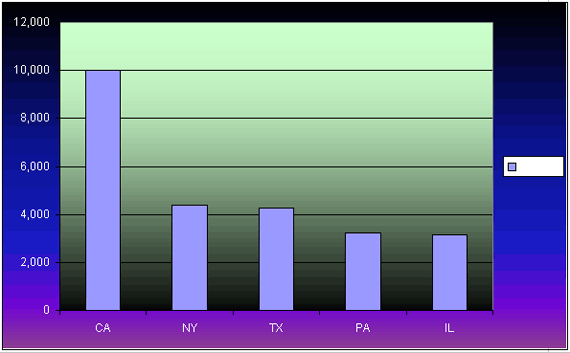
Pictorial view of top states using SAP Applications

Job Title Available :
| Title Department | Records |
| Accounts | 3,112 |
| Admin | 5,965 |
| Applications | 204 |
| Business Development | 1,574 |
| Customer Service | 3,673 |
| Engineer | 18,383 |
| Executive | 14,738 |
| Finance | 13,930 |
| HR | 14,433 |
| IT | 53,491 |
| Marketing | 17,669 |
| Operation | 9,404 |
| R&D | 3,694 |
| Sales | 11,214 |
| Sales & Marketing | 6,578 |
| Supply Chain & Logistics | 1,978 |
| Others | 193,191 |

Usage Of This List :
Comprehensive Marketing List with Complete Detail – Ideal for Personalized Email Marketing as it includes email. Good for Telemarketing and Direct Mail Campaigns as well.
*Count breakdowns and titles/specialties may change without prior notice with our updates.
ORDER LIST NOW
